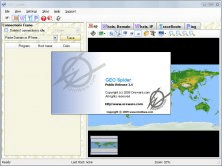
GeoDa is a free software program that serves as an introduction to spatial data analysis. OpenGeoDa is the cross-platform, open source version of Legacy GeoDa. While Legacy GeoDa only runs on Windows XP, OpenGeoDa runs on different versions of Windows (including XP, Vista and 7), Mac OS, and Linux. It is written in C and no longer relies on ESRI's MapObjects library (it uses wxwidgets instead).
We are working towards eventually releasing OpenGeoDa as an open source program.
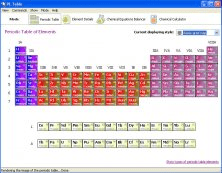
GeoDa is the flagship program of the GeoDa Center, following a long line of software tools developed by Dr. Luc Anselin. It is designed to implement techniques for exploratory spatial data analysis (ESDA) on lattice data (points and polygons). The free program provides a user friendly and graphical interface to methods of descriptive spatial data analysis, such as spatial autocorrelation statistics, as well as basic spatial regression functionality.
The latest version contains several new features such as a cartogram, a refined map movie, parallel coordinate plot, 3D visualization, conditional plots (and maps) and spatial regression.
Since its initial release in February 2003, GeoDa's user numbers have increased exponentially. Since its launch, more than 52,000 people downloaded GeoDa across the globe, including lab users at universities such as Harvard, MIT, and Cornell.
The program is supported by the Openspace listserv. The user community and press embraced the program enthusiastically, calling it a "hugely important analytic tool," a "very fine piece of software," an "exciting development" and more.
Main features:
Data Input and Output
-read and write shape files
-copy graphs and maps to clipboard
-save maps and graphs to bitmap file
Spatial Data Manipulation
- create point shape files from text files
-centroids for polygons
-Thiessen polygons from points
-contiguity based spatial weigths for polygons
-distance based spatial weights for points and polygons visualization and Queries
- graphs, maps and table
- linking and brushing of all maps and graphs, multiway linking of table
- spatial selection on maps
-query selection in table
Mapping
- quantile and standard deviational maps
-outlier maps: box map and percentile map
-rate mapping and smoothing: excess risk map, Empirical Bayes smoothing, spatial smoothing
map movie
EDA
-histogram
- box plot
- scatter plot
- full dynamic linking and brushing
Spatial Statistics
- Moran's I
-Moran scatterplot: univariate, bivariate, EB corrected
-LISA local Moran: univariate, bivariate, EB corrected

Combines geometries using the spatial methods STDifference, STIntersection, etc.


Comments (2)